Notifications
ALL BUSINESS
COMIDA
DIRECTORIES
ENTERTAINMENT
FINER THINGS
HEALTH
MARKETPLACE
MEMBER's ONLY
MONEY MATTER$
MOTIVATIONAL
NEWS & WEATHER
TECHNOLOGIA
TV NETWORKS
VIDEOS
VOTE USA 2026/2028
INVESTOR RELATIONS
COMING 2026 / 2027
ALL BUSINESS
COMIDA
DIRECTORIES
ENTERTAINMENT
FINER THINGS
HEALTH
MARKETPLACE
MEMBER's ONLY
MONEY MATTER$
MOTIVATIONAL
NEWS & WEATHER
TECHNOLOGIA
TV NETWORKS
VIDEOS
VOTE USA 2026/2028
INVESTOR RELATIONS
COMING 2026 / 2027
About Me
 Latinos Media
 Latinos Media provides all types of news feeds on a daily basis to our Members
Posted by - Latinos Media -
on - April 20, 2024 -
Filed in - News -
-
804 Views - 0 Comments - 0 Likes - 0 Reviews

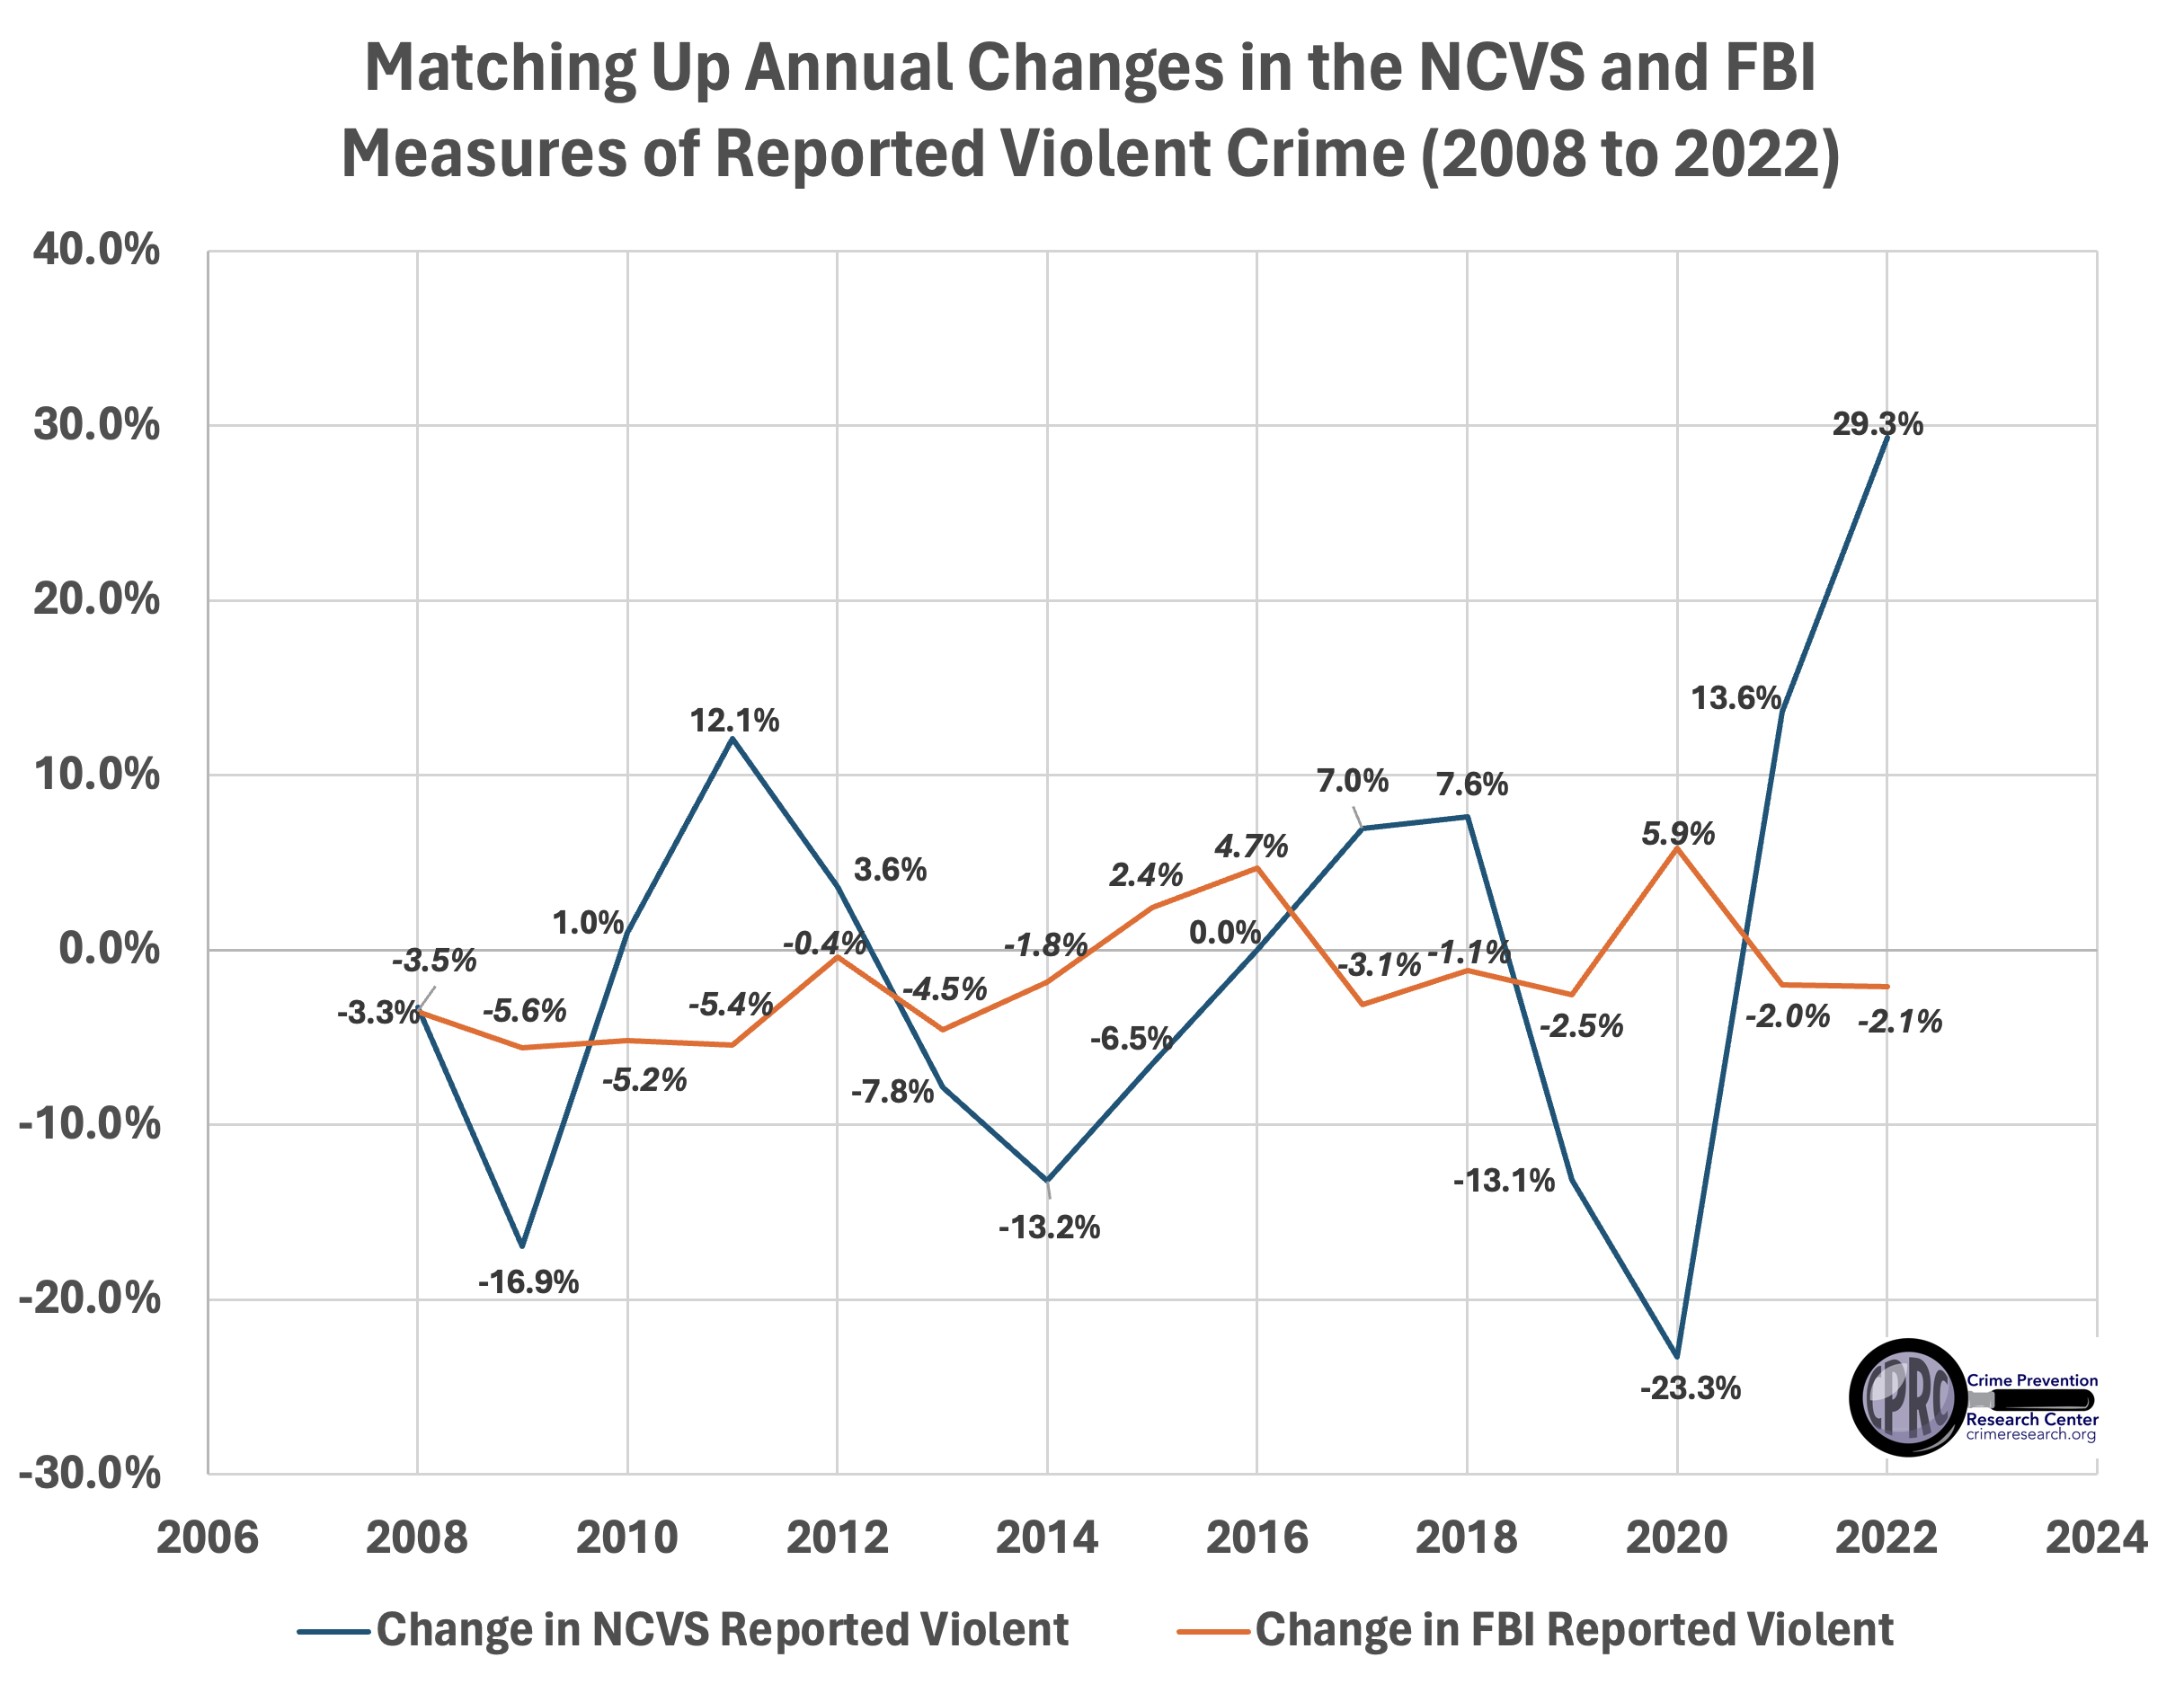
The U.S. employs two distinct measures of crime. The Federal Bureau of Investigation’s Uniform Crime Reporting program counts the number of crimes reported to police annually. The Bureau of Justice Statistics, in its National Crime Victimization Survey (NCVS), asks 240,000 people a year whether they have been victims of a crime. The two measures have diverged since 2020: The FBI has reported less crime, while more people say they have been victims. For example, between 2021 and 2022, the FBI UCR showed reported violent crime fell by 2.1%, but the NCVS showed reported violent crime increased by 29.3%. The figure at the top of this post clearly shows how the two measures rarely move together.
As previously noted, the news media relies exclusively on FBI-reported violent crime data. We previously discussed how the FBI-reported crime rates are unrelated to the NCVS. The evidence shown here indicates real problems with the FBI-reported violent crime measure and that the FBI data are extremely misleading after 2020.
The next figure in this post shows the changes in reported violent crimes for these two measures over the fifteen years from 2008 through 2022. As you can tell from the figure, the correlation coefficient is -0.2389. From 2008 to 2019, the correlation is very slightly positive: 0.0473. But from 2020 to 2022, these two numbers are almost perfectly negatively correlated: -0.9597. Thus, the two measures are unrelated over the earlier period, and in the later period, they move in opposite directions. None of this generates confidence in the FBI UCR data.

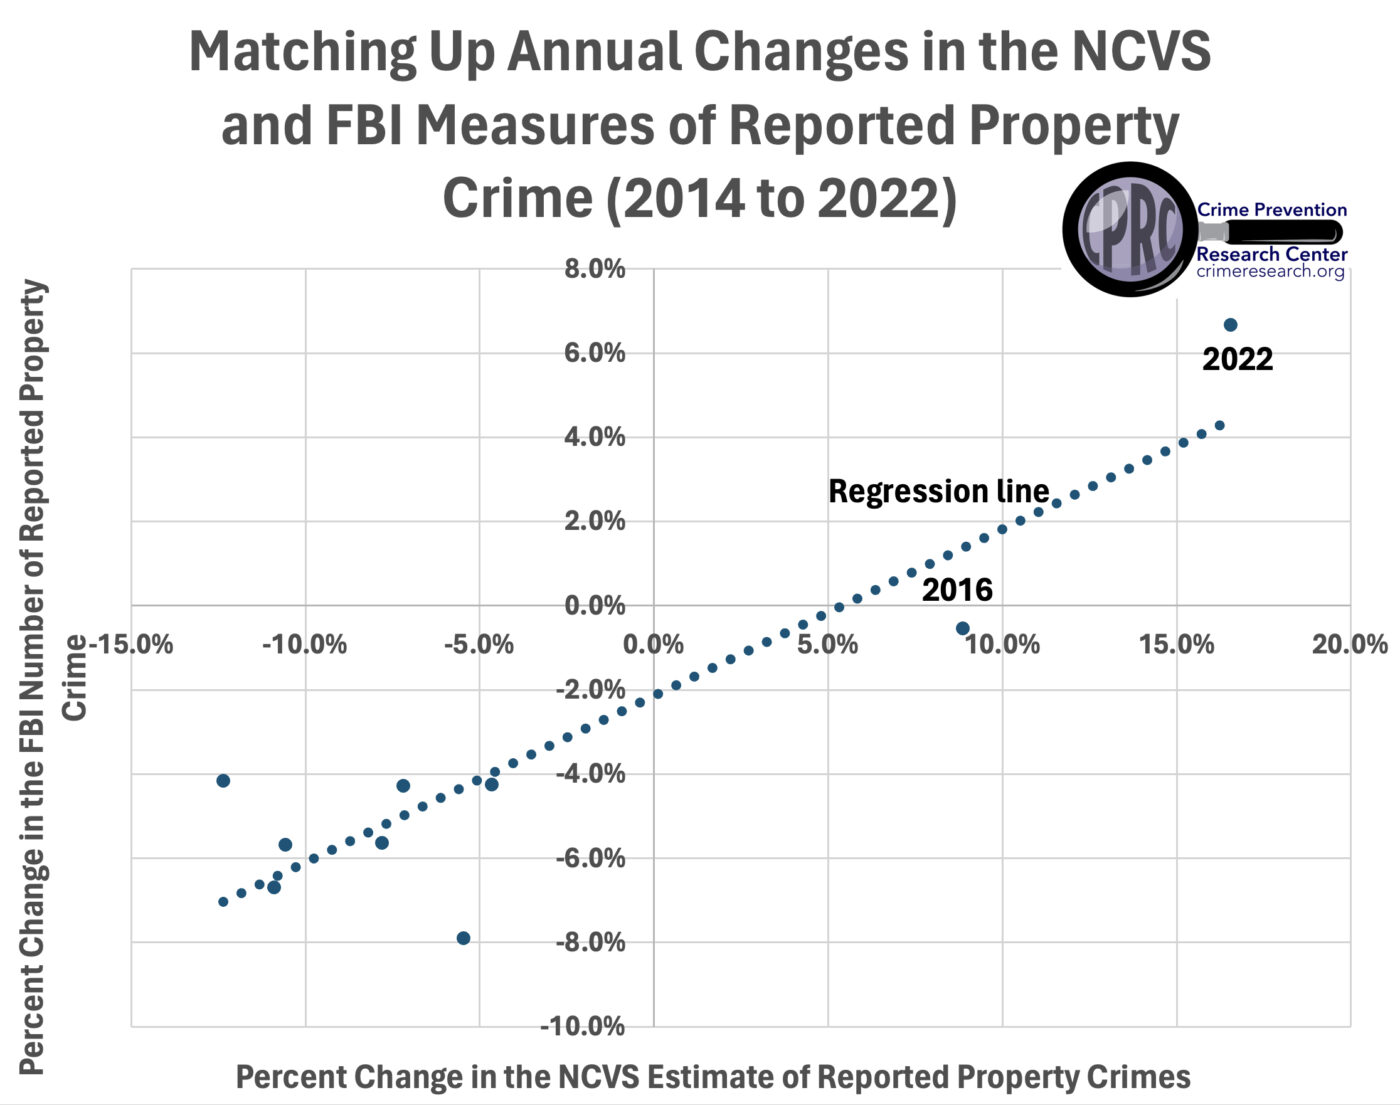
By contrast, reported property crime rates for these two measures are closely related over the whole period (correlation coefficient 0.8919), and their correlation coefficients are very similar in the two periods.

The divergence is due to several reasons. In 2021, 37% of police departments nationwide, including Los Angeles and New York, stopped reporting crime data to the FBI. The more important point here is how this has changed over time. As the Washington Examiner notes: “In 2019, 89% of agencies covering 97% of the population submitted data, but by 2021, that coverage plummeted to less than 63% of departments overseeing just 65% of the population.“
In addition, in cities from Baltimore to Nashville, the FBI is undercounting crimes those jurisdictions reported.
And the figures the agencies do report to the FBI do not match the agencies’ publicly reported figures. For Baltimore, the FBI reported 225 murders in 2023, but the city reported 262 — which means the FBI left out 37 murders. In Milwaukee, the police department reported a 7% increase in robberies, but the FBI showed a 13% drop. Nashville’s own data tallied more than 6,900 aggravated assaults in 2023, but the FBI counted only 5,941, leaving almost 1,000 of those offenses “missing.” This trend is consistent across the board: While 2022’s FBI city-level figures track the police’s own data, the 2023 numbers consistently undercount offense totals. Any year-to-year comparison overstates decline.
Mark Morgan and Sean Kennedy, “Bad data from the FBI mislead about crime,” Washington Examiner, April 5, 2024.
Here are two simple regressions showing that the changes in reported crimes using the FBI and NCVS data were unrelated in the pre-2020 period and negatively related in the period from 2020 on.

| Year | Change in NCVS Reported Violent | Change in FBI Reported Violent |
| 2008 | -3.3% | -3.5% |
| 2009 | -16.9% | -5.6% |
| 2010 | 1.0% | -5.2% |
| 2011 | 12.1% | -5.4% |
| 2012 | 3.6% | -0.4% |
| 2013 | -7.8% | -4.5% |
| 2014 | -13.2% | -1.8% |
| 2015 | -6.5% | 2.4% |
| 2016 | 0.0% | 4.7% |
| 2017 | 7.0% | -3.1% |
| 2018 | 7.6% | -1.1% |
| 2019 | -13.1% | -2.5% |
| 2020 | -23.3% | 5.9% |
| 2021 | 13.6% | -2.0% |
| 2022 | 29.3% | -2.1% |
The NCVS data is available here.
https://bjs.ojp.gov/document/cv22.pdf
https://bjs.ojp.gov/content/pub/pdf/cv21.pdf
https://bjs.ojp.gov/sites/g/files/xyckuh236/files/media/document/cv20.pdf
https://bjs.ojp.gov/content/pub/pdf/cv18.pdf